Background
The Analytics Movement
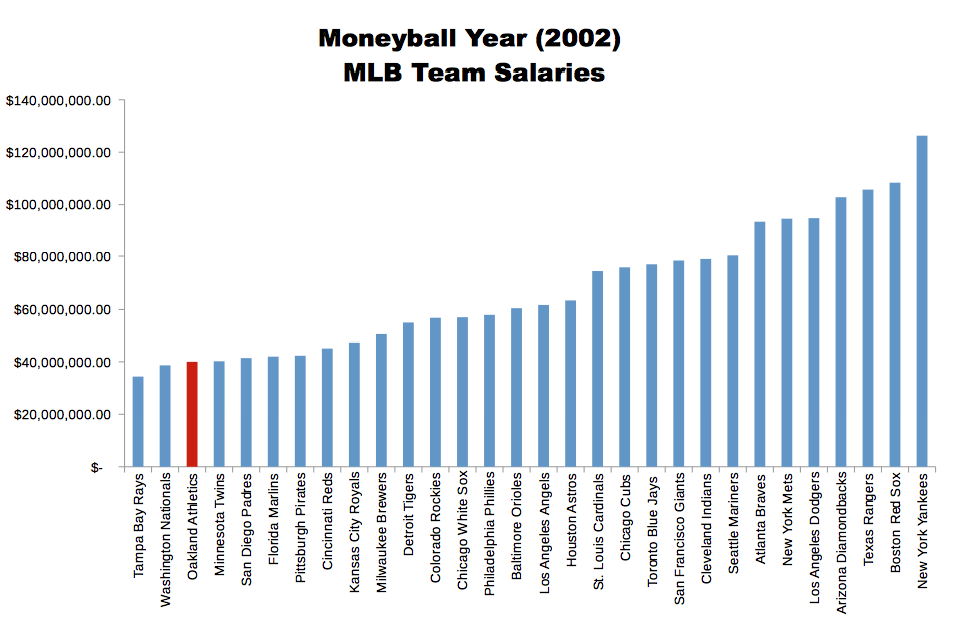
The term analytics in sports refers to using statistical analysis to inform decisions ranging from player personnel to in-game team strategy. This idea began in baseball with sabermetrics, which is “the search for objective knowledge about baseball.” The term was coined by Bill James as a nod to the Society for American Baseball Research(SABR). Statistical evaluations in baseball predate James’ work, but his seminal Baseball Abstract1 helped start the broader movement. This approach was not widely adopted until 2002 when Billy Beane (then general manager of the low-budget Oakland Athletics) used objective analytical gages to exploit market inefficiencies, ushering in the Moneyball2 era. They valued on-base percentage and slugging percentage over more traditional metrics, which flew in the face of scouts and their often subjective measures of forecasting player performance. However, the A’s were successful—winning an American League record 20 consecutive games—with a payroll roughly 40% that of big-budget teams and only about a third that of the free-spending Yankees, as shown in the chart below.3 As a result, teams from several sports now employ statistical analysts—some even have entire departments—and there is a conference dedicated to sports analytics.
The impact of analytics in sports is evidenced by many examples including:
- MLB’s increased attention to on-base percentage beginning in the early 2000s
- The rise of the three-point shot and fall of the midrange jumper in the NBA with players like Stephen Curry and James Harden leading the charge
- Increase in short, high-percentage passes in the NFL
Sports provide an enticing testbed for machine learning. In a FiveThirtyEight article by Nate Silver, he identified three reasons “sports nerds have it easy.”
- “Sports has awesome data.” Silver describes sports data as not just big data, but rich data, which he defines as “accurate, precise, and subject to rigorous quality control.” Data is also readily available with many websites across a variety of sports offering a plethora of information.
- “In sports, we know the rules.” This allows us to have strong intuition as to what stats make good predictive variables before ever making a model.
- “Sports offers fast feedback and clear marks of success.” The objective of sports is winning. While that is not a novel concept, such a clear-cut goal is not always present in other subjects. However, the problem does become more complicated when framed in the context of a betting scenario, such as determining the classification probability threshold to maximize return on investment (ROI).
Why the NBA?
I chose to focus on basketball primarily because the NBA is arguably the most deterministic of the major American professional sports leagues, providing an easier problem to tackle compared to other sports. Look no further than the 2017 NBA playoffs, where there are two 8-0 teams in the same conference finals for the first time in NBA history. Those teams—the Cleveland Cavaliers and Golden State Warriors—each made it to 10-0 and enter the finals a combined 24-1 to face each other in the finals for a third consecutive season. The best teams simply win more often in the NBA than in other sports. A team winning 70% of their games in a given NBA season happens quite often, and is also a strong indicator the team will do well the following season. The much tighter spread of MLB winning percentages makes baseball quite difficult to predict consistently. The NFL likes to say it has parity, but it is more an artifact of small sample size. A team that goes on a lucky winning streak can have a record at season’s end that is inflated compared to its underlying talent level, making it more difficult to predict. The NHL is also notoriously random.
The Harvard Sports Analysis Collective (HSAC) took an interesting approach and calculated the Gini coefficient of preseason title odds for various sports leagues. The Gini coefficient is a metric used to measure the distribution of a resource—typically to evaluate a nation’s income inequality—and ranges from 0 (resources evenly spread) to 1—or 100%—(one person/group holds all the resources). Not only did they find the NBA would be the world’s most unequal economy, they found the NBA has the least amount of parity of the four major American sports by far. With recent developments from the rise of the Warriors and Cavs to the Philadelphia 76ers’ rebuilding “process” (read tanking) leading to losses aplenty, there are few seats at the table to actually contend for a championship. Lately, the NBA looks more like England’s Premier League or Spain’s La Liga where the same handful of teams have any realistic shot at the title each season.
Sports Betting
The world of sports betting can be very lucrative for those that are skilled at it. The sports bettor Haralabos Voulgaris makes a million dollars in a “bad” year.4 This potential payout coupled with the perception that anyone can do it leads sports betting to be a big industry. An all-time high of $4.2 billion was bet on sports in Nevada in 2015, the sixth straight year a record amount was bet. However, it is difficult to be a successful sports bettor. Oddsmakers are very good at their jobs and teams’ records against the spread (one of the most popular sports bets) do not typically deviate far from 50%. A perfect example of this is the 2015-16 Golden State Warriors, who set an NBA record for wins in a season with 73. According to covers.com, they were a mere 45-35-2 against the spread and their over/under record was nearly identical at 45-36-1, meaning their games hit the over 45 times.
Betting on the spread involves picking winners of games where the favorite is handicapped. For example, if a given team is favored by 5 points and wins by more than 5, they are said to have “covered” and won against the spread. The betting line for this scenario will be set at -5 for the favorite and bets placed on the favorite will pay out. The opposite holds true for underdogs. They cover by either winning outright or losing by less than the point spread. An over/under bet requires comparing the total number of points scored by the two teams in a given game to the line set by the oddsmakers. Bettors must decide if they think the total points scored will be over or under this value. These provide more challenging problems than simply picking game winners. In the event that the point difference in a game equals the point spread or the total points scored equals the over/under line, the game is said to “push” and wagers are returned. Oddsmakers will often set the lines to fractional point values to avoid this situation.
The workflow outlined here can be used by prospective sports bettors to help inform their decisions. They can use it to determine which team to bet on in a given game. They can also flag games the model has low confidence in to avoid betting on difficult games. Lastly, they can identify the most attractive games to bet on by finding games in which the model predicts the underdog will win. Underdogs are on the beneficial side of the moneyline since they do not win as often as the favorites. Betting on underdogs does not require risking as much money as betting on the favorites and successful bets on the underdogs pay out more.
-
James, Bill. The Bill James Historical Baseball Abstract. Villard, 1985. ↩
-
Lewis, Michael. Moneyball: The Art of Winning an Unfair Game. W. W. Norton & Company, 2003. ↩
-
By Darryl Leewood (Own work) [CC BY-SA 3.0 (http://creativecommons.org/licenses/by-sa/3.0)], via Wikimedia Commons ↩
-
Silver, Nate. The Signal and the Noise: Why So Many Predictions Fail — but Some Don’t. Penguin Books, 2012. ↩